


The GMRT Epoch of Reionization experiment: a new upper limit on the neutral hydrogen power spectrum at z ≈ 8.6
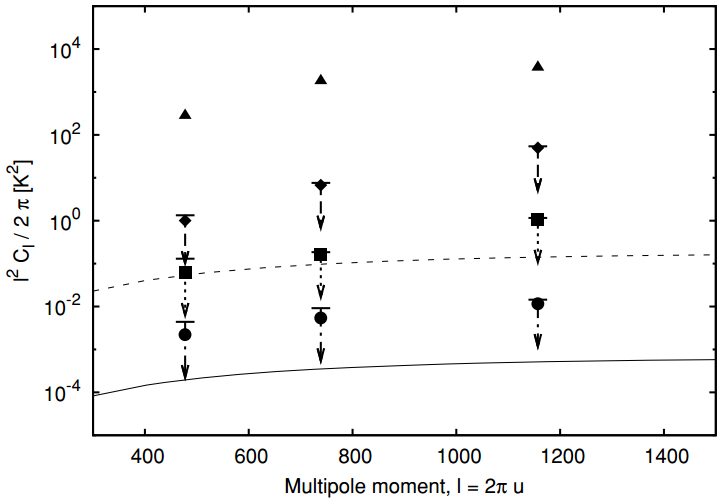
Average power spectrum in units of K 2 of all combinations of days, excluding December 11, as a function of the multipole moment l. Each point is shown with a 2σ upper limit derived from a bootstrap error analysis, which is in most cases smaller than the size of the point. The points are logarithmically spaced as described in the text, from left to right covering the ranges 377 < l < 578, 578 < l < 899 and 899 < l < 1414. Triangles are the power before subtracting foregrounds, diamonds are after 8 MHz mean subtraction, squares are after 2 MHz mean subtraction and circles are after 0.5 MHz subtraction. The curved solid line is the theoretical EoR signal from Jelic et al. (2008), and the dashed line is the theoretical EoR signal ´ with a cold absorbing IGM as described in the text.
For epoch of reionization (EoR), we have been utilizing the the Giant Metrewave Radio Telescope (GMRT) in India to measure the 21-cm power spectrum at redshifts 8 < z < 9, constraining the fluctuation of ionization. We have put a first upper limit on the amplitude of the power spectrum at a mean redshift of 8.5 (Paciga et al. 2011), as shown in figure below. The upper limit is within one order-of-magnitude of the currently popular theoretical expectations, and already rules out models where the intergalactic medium was not heated before reionization.